Monitoring
Google Cloud Operations suite
- previously stackdriver
- Integrated monitoring, logging, diagnostics
- Manages across platforms
- Google Cloud and AWS
- Dynamic discovery of Google Cloud with smart defaults
- Open-source agents and integrations
- Access to powerful data and analytics tools
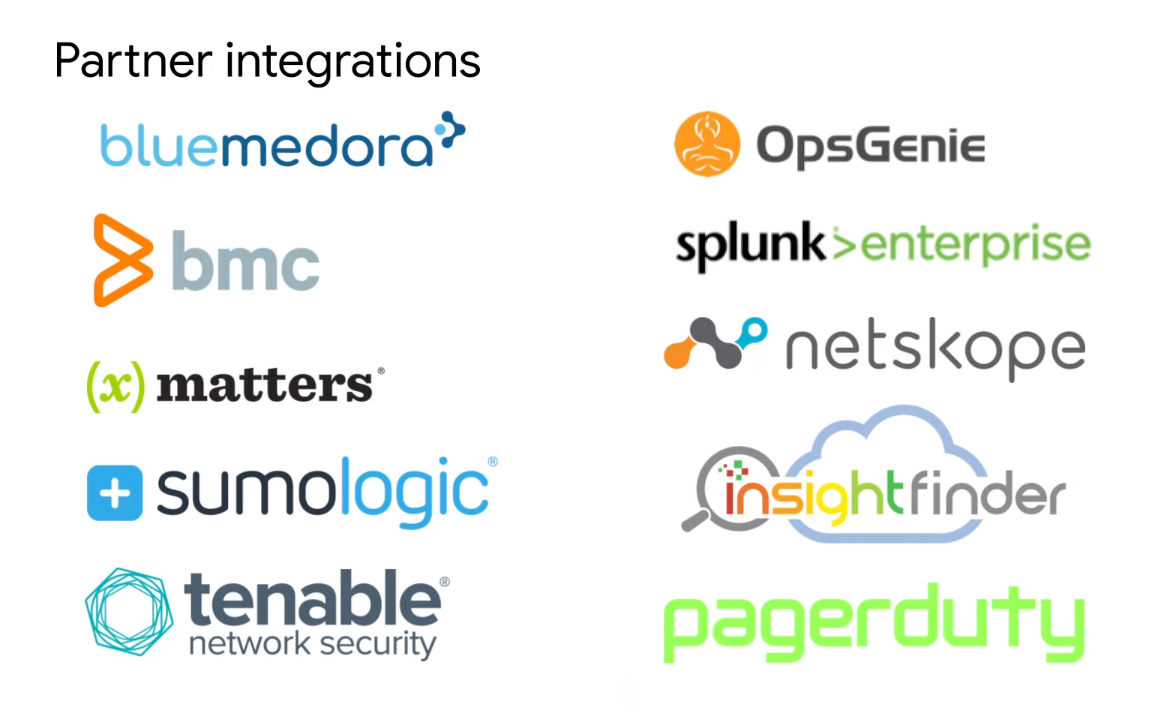
- Collaboration with third-party software
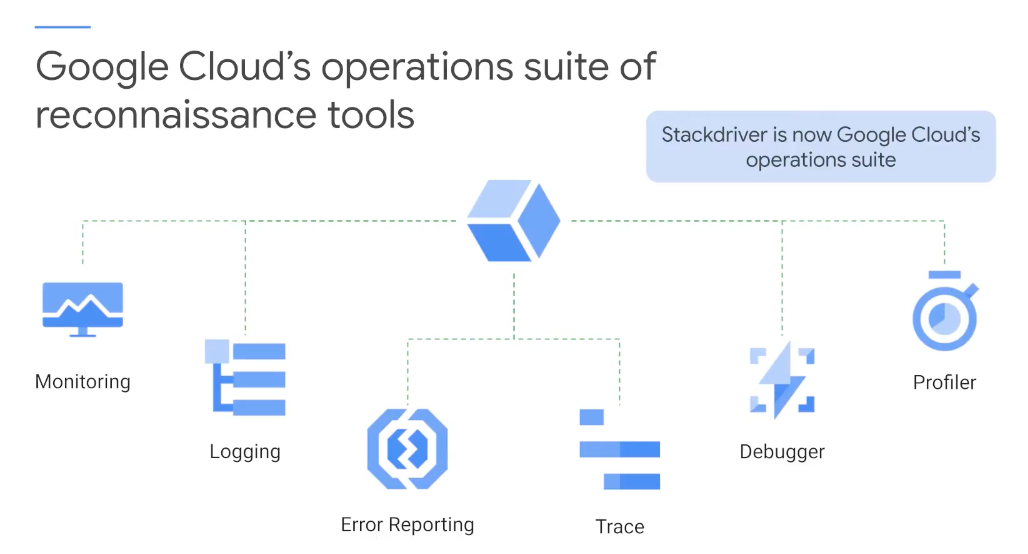
Cloud Monitoring
- Dynamic config and intelligent defaults
- Platform, system, and application metrics
- ingests data: Metrics, events, metadata
- Generates insights through the dashboard, charts, alerts
- Uptime/health checks
- Dashboards
- Alerts
Custom metrics
- Use the Cloud Monitoring API
- Use OpenCensus
- Open-source library to help capture, manipulate, and export traces and metrics
- Low overhead and broadly supported
- Measure
- represent a metric being recorded
- Measurement
- data point recorded as a Measure
- View
- represents the coupling of an Aggregation applied to a Measure and optionally Tags
Logs-based Metrics
- Don't reinvent the wheel (Google has a curated list of over 1,000 predefined metrics, check there first)
- Metric types
- Counter - counts the number of log entries
- Distribution - extracted log values in histogram buckets
- Linear: buckets of fixed width
- Exponential:
- N+2 buckets
- Upper:scale * (growthFactor ^ i)
- Lower:scale * (growthFactor ^ (i-1))
- Explicit: Array of bucket boundaries
OS Monitoring Agent
- Support Compute Engine and AWS EC2
- Based on the open-source collected
- Gathers additional system resources and application metrics
- Optional, but recommended
- The additional support offered through BindPlane from Blue Medora
OS Logging Agent
- Support third-party applications, such as
- Apache/Tomcat/Nginx
- Chef/Jenkins/Puppet
- Cassandra/MongoDB/MySQL
- Based on fluentd log data collector (can add own fluentd configuration files)
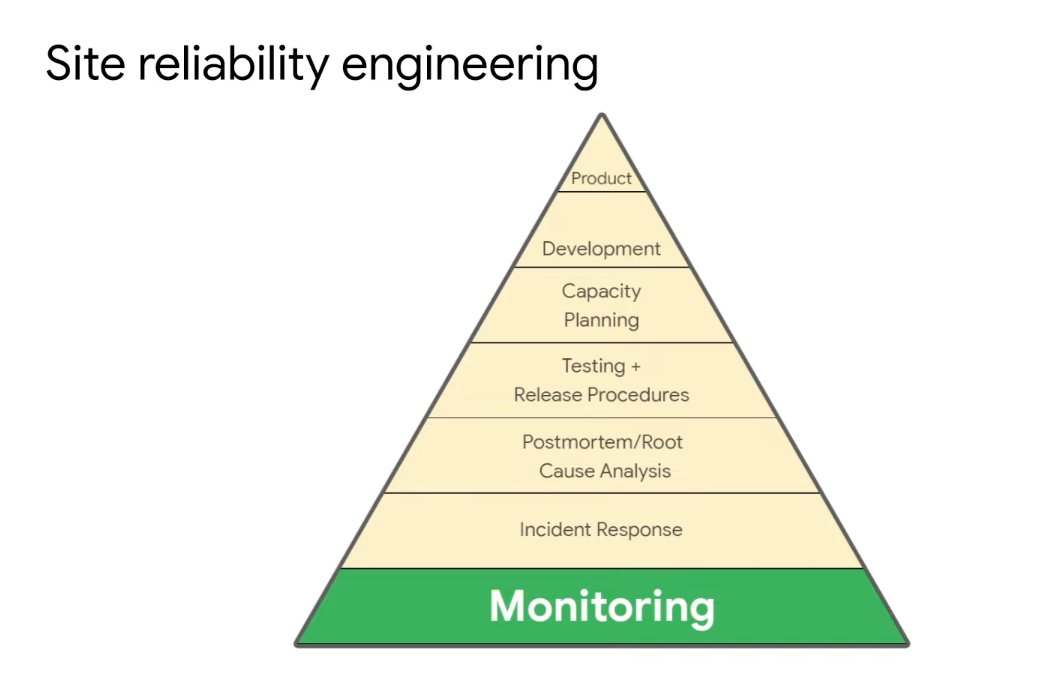
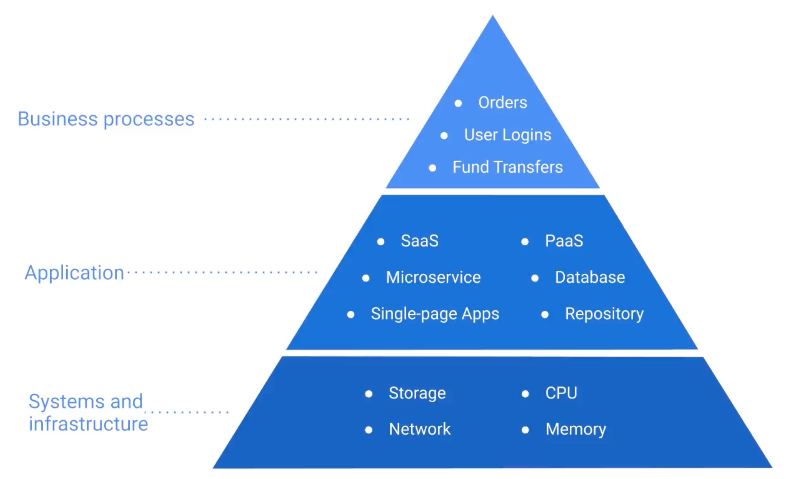
Monitoring pyramid
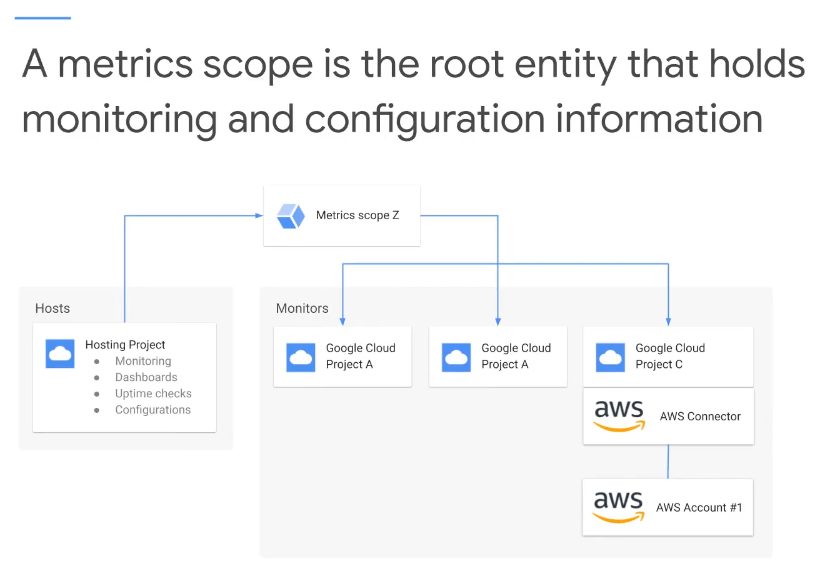
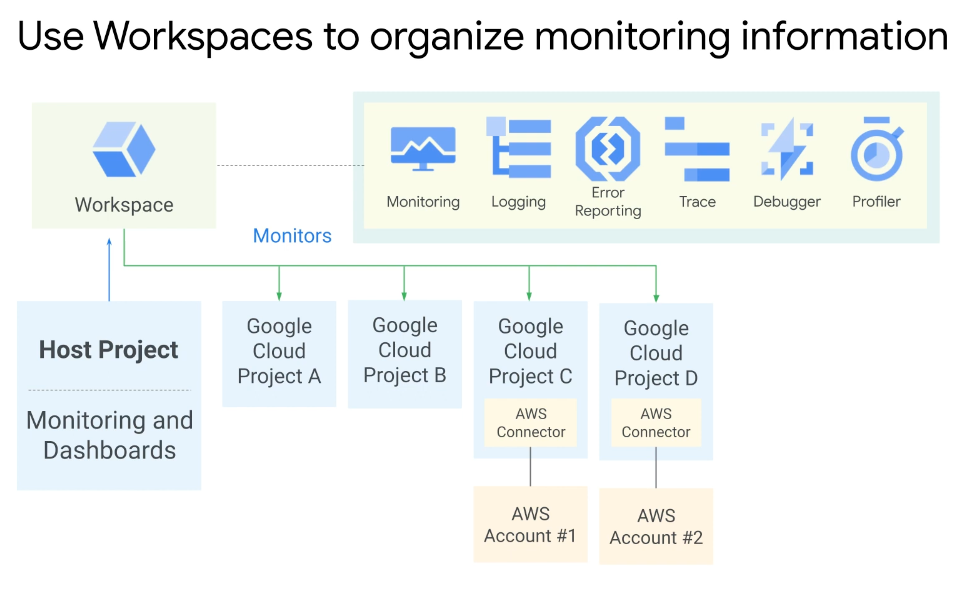
Workspace
- Determine your monitoring needs upfront
- Consider using separate Workspaces for data and control isolation
Cloud Logging
- Platform, systems, and application logs
- API to write to logs
- 30-day retention
- Log search/view/filter
- Log-based metrics
- Monitoring alerts can be set on log events
- Data can be exported to Cloud Storage, BigQuery, and Pub/Sub
- Export to Cloud storage, BigQuery, and Pub/Sub
- Data access logs are and Admin logs for 400 days
- Logs
- Cloud Audit Logs
- Admin activity
- API calls modifying configuration or metadata
- retained for 400 days
- no charge
- Always Enabled
- Data Access
- API calls that read metadata, and configuration or that create, modify, or read user-provided data
- retained for 1-3650 days (30 default)
- Data access by All Users or All Authenticated Users
- Needs to be enabled
- System Event
- Record Google Cloud non-human admin actions that modify configurations
- Part of Google's transparency
- no charge
- Retention is 400 days
- Always Enabled
- Access Transparency
- How and Why customer data is accessed once it has been Stored in Google Cloud
- Admin activity
- Agent Logs
- Network Logs
- VPC flow
- Firewall rules
- NAT gateway
- Load Balancer
- Cloud Audit Logs
- Firewall Rule Logging
Log Router (Sink)
- Logs from various sources reach Log Router
- Checks against configured rules (What to ingest? What to discard? Where to route?)
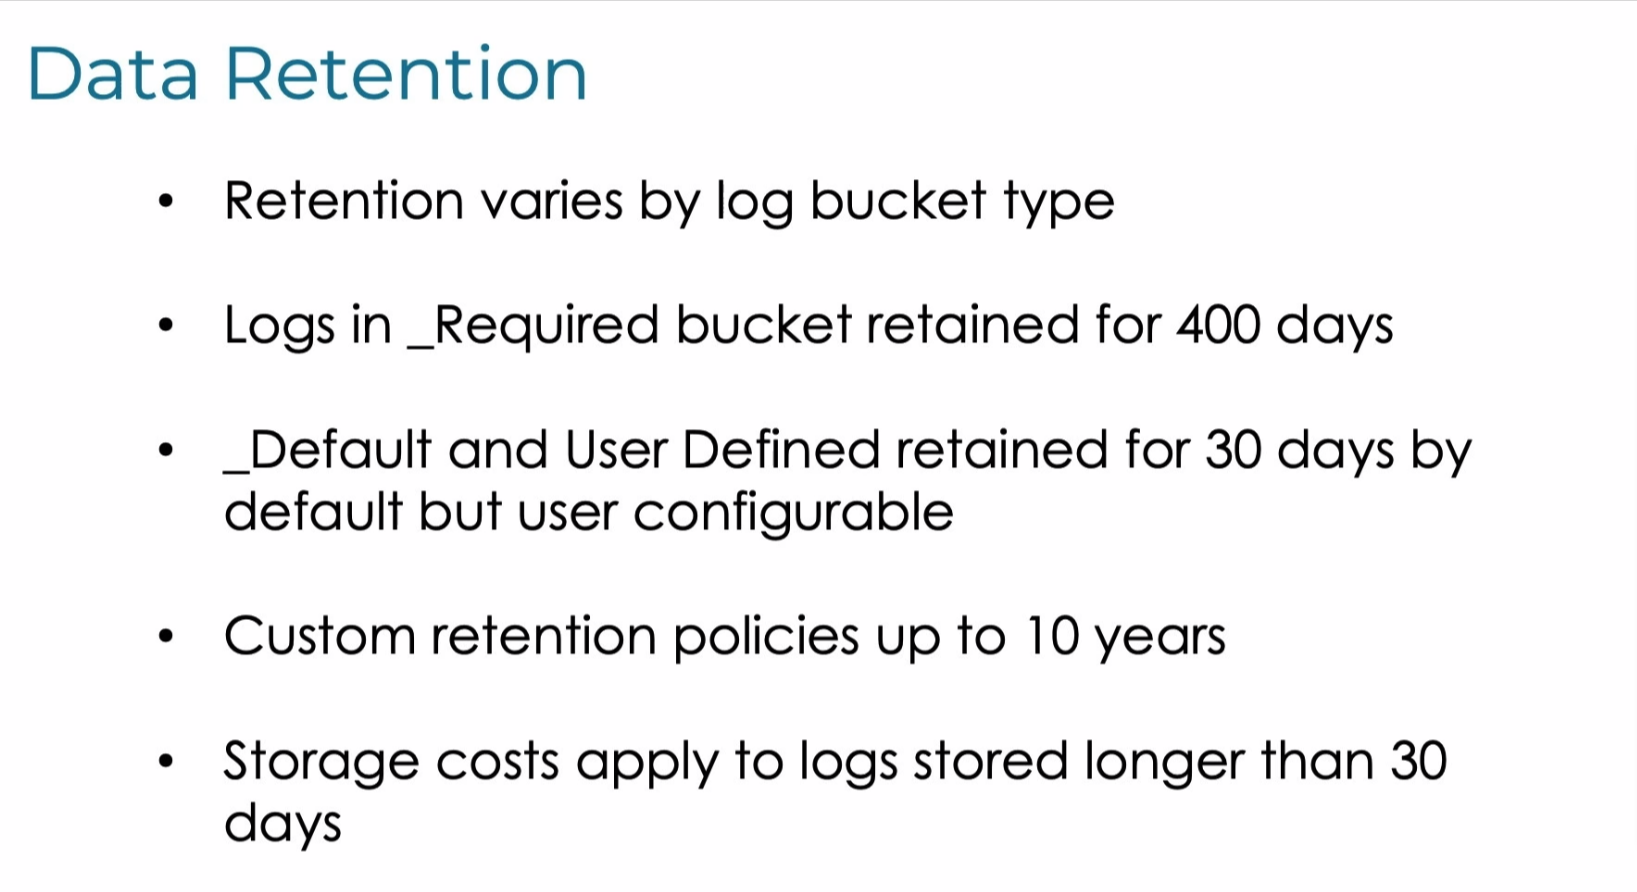
- Logs Storage (Logs buckets)
- _Required
- Hold Admin activity, System Events & Access Transparency Logs (retained for 400 days)
- ZERO charge
- Can't change the retention period
- _Default
- All other logs (retained for 30 days)
- Can't DELETE but can disable log sink to disable ingestion
- Can edit retention settings from 1 to 3650 days
- _Required
Data Studio
- Connect to BigQuery
- Transform raw data into metrics and dimensions
Error Reporting
- Error dashboard/notification
- Counts analyze and aggregate the crashes in your running cloud services
- Management interface displays the results with sorting and filtering capability
- Centralized error management interface
Cloud Trace
- Displays data/performance insights in near real-time
- Latency reporting
- Per-URL latency sampling
- Automatically analyzes to generate in-depth latency reports
- Support
- App Engine
- Google HTTP(S) load balancers
- Applications instrumented with the Cloud Trace SDKs
Cloud Debugger
- Inspect an application without stopping it or slowing it down significantly
- Capture call stack and local variables of a running application
- Inject logging into a service without stopping it
- Increased collaboration by sharing debug session
- Debug snapshots, logpoints, conditional debugging
- Integrations with popular IDEs
Cloud Profiler
- Uses statistical techniques and extremely low-impact instrumentation that runs across all production application instances to provide a complete CPU and heap picture of an application
- Support for Java, Go, Python, and NodeJS
- Presents the call hierarchy and resource consumption of the relevant function in an interactive flame graph
- Improve performance and reduce costs
- Understand application call patterns
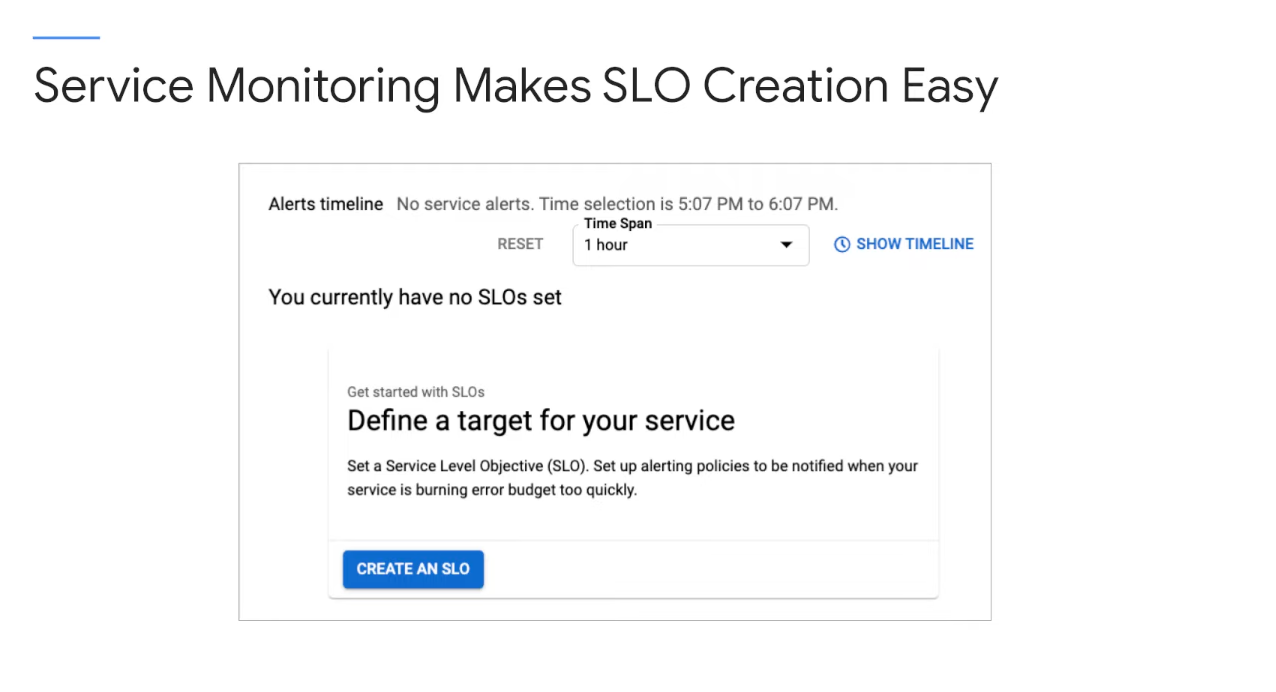
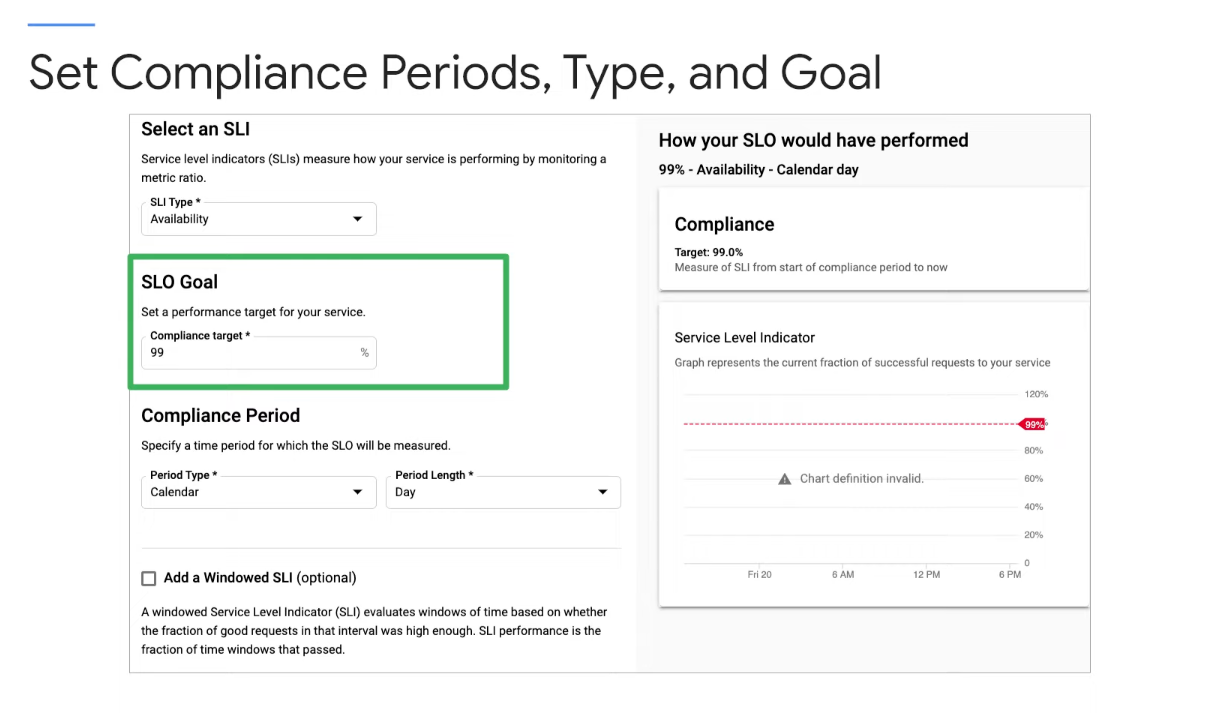
Service Monitoring
- Understand and troubleshoot intra-service dependencies
- Current support for App Engine, Anthos Service Mesh, and Istio
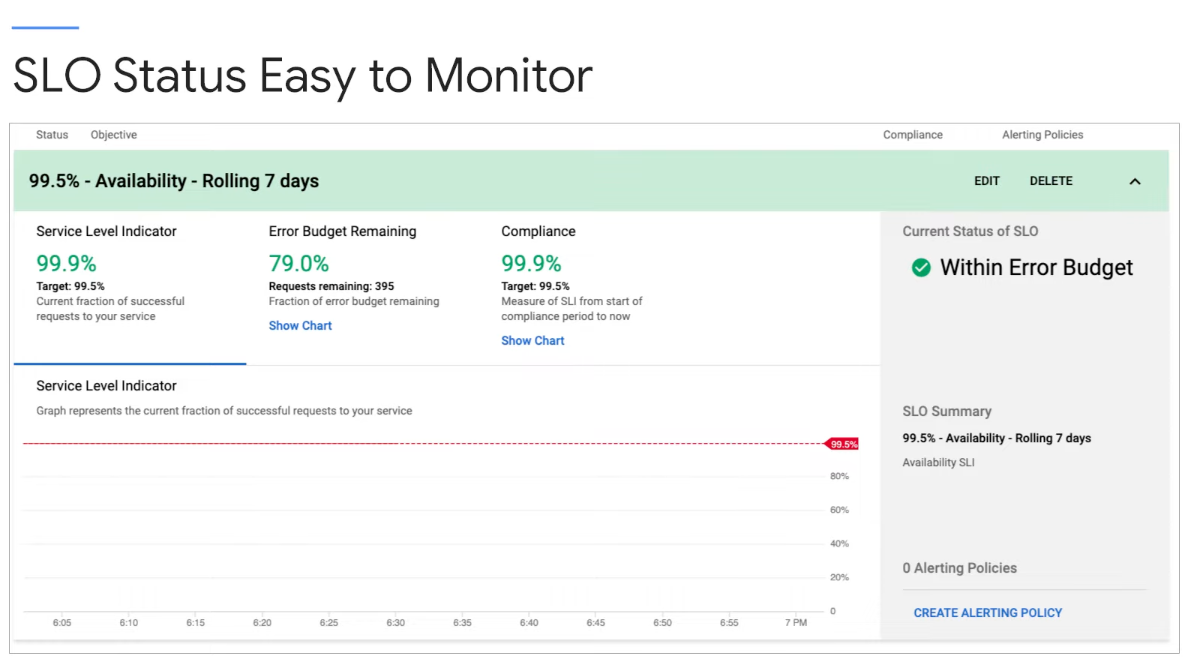
- Know when you're meeting or breaking SLOs
- Know when you have an error budget to spend
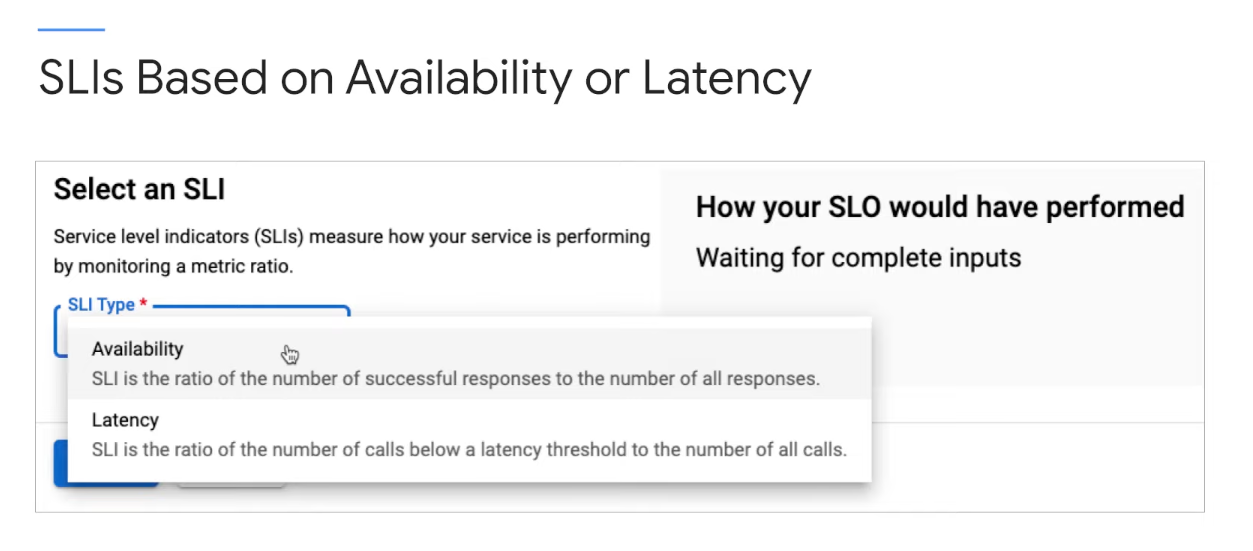
- Select latency or availability metrics to act as SLIs
- Use SLIs to easily create SLOs
- Alerting easily integrated
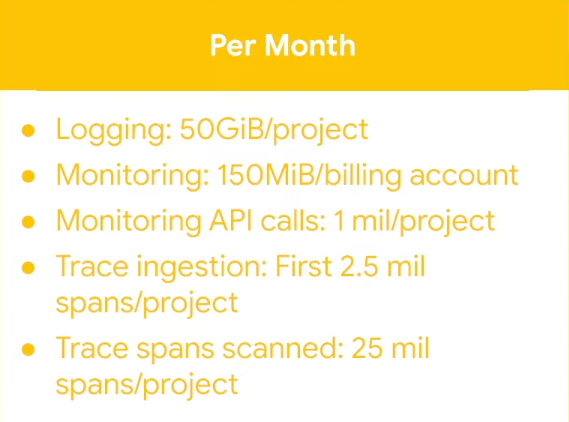
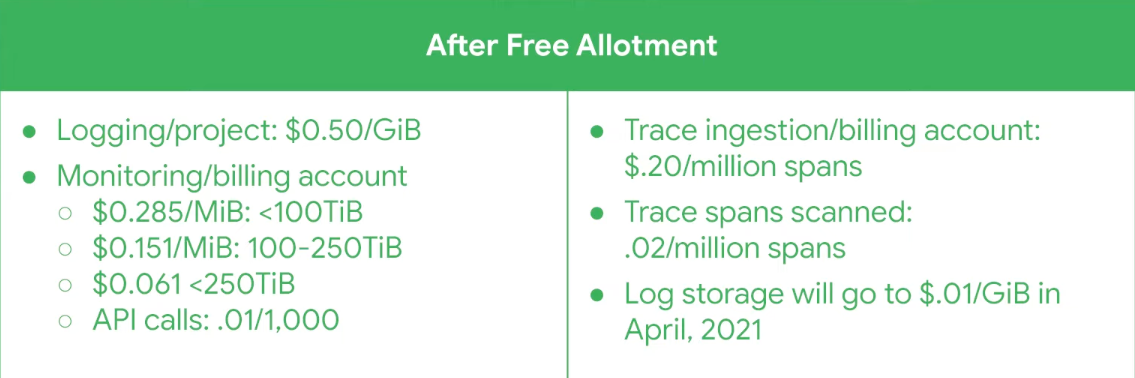
Pricing
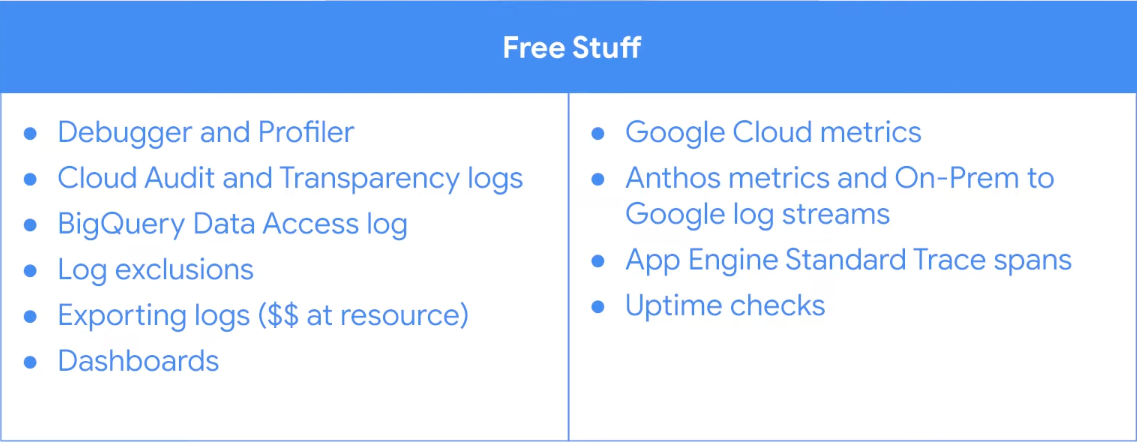
Free Allotment